Working on servers is a part-and-parcel these days with resources like GPUs being essential to Deep learning, it is essential that one can work on servers, academic or AWS. But starting to work on them can be daunting at first and does involve a learning curve that can slow down your progress at first. So here are some tricks that I have found useful over my experience with them. First thing first ssh protocol to the rescue!
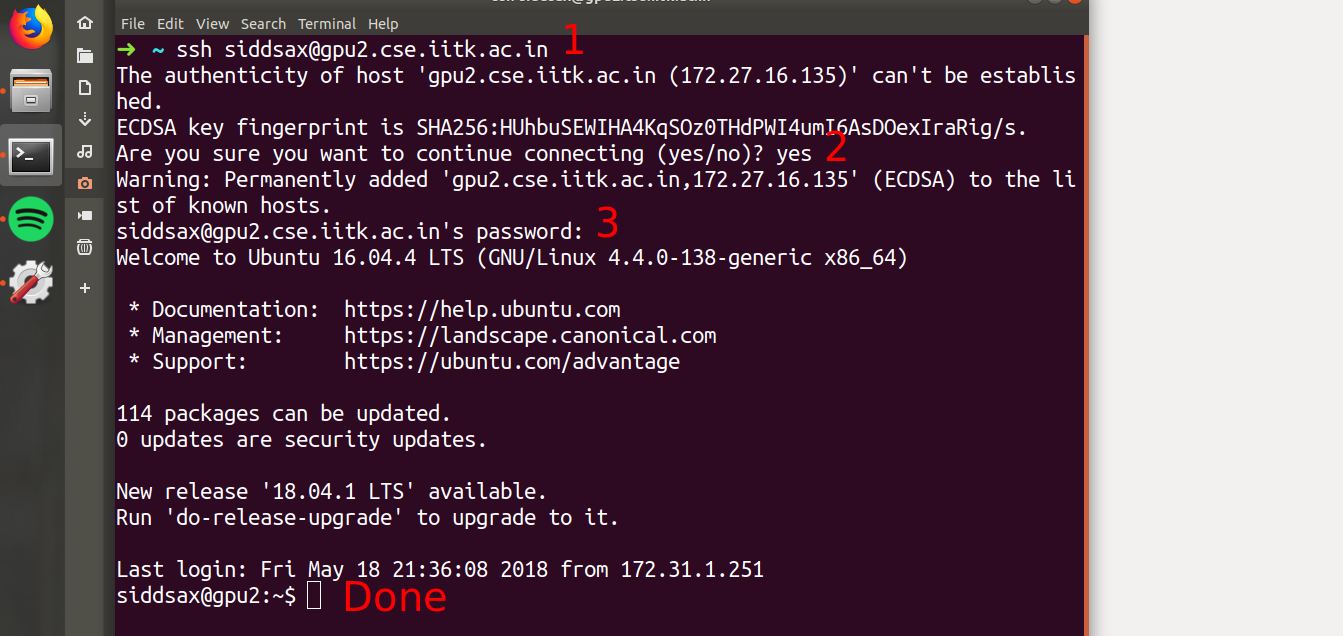
Make sure you have working internet ( and VPN if required ) and then type in the following command. An example for my IITK server gpu1.cse.iitk.ac.in it will be The Steps described above are summarized below
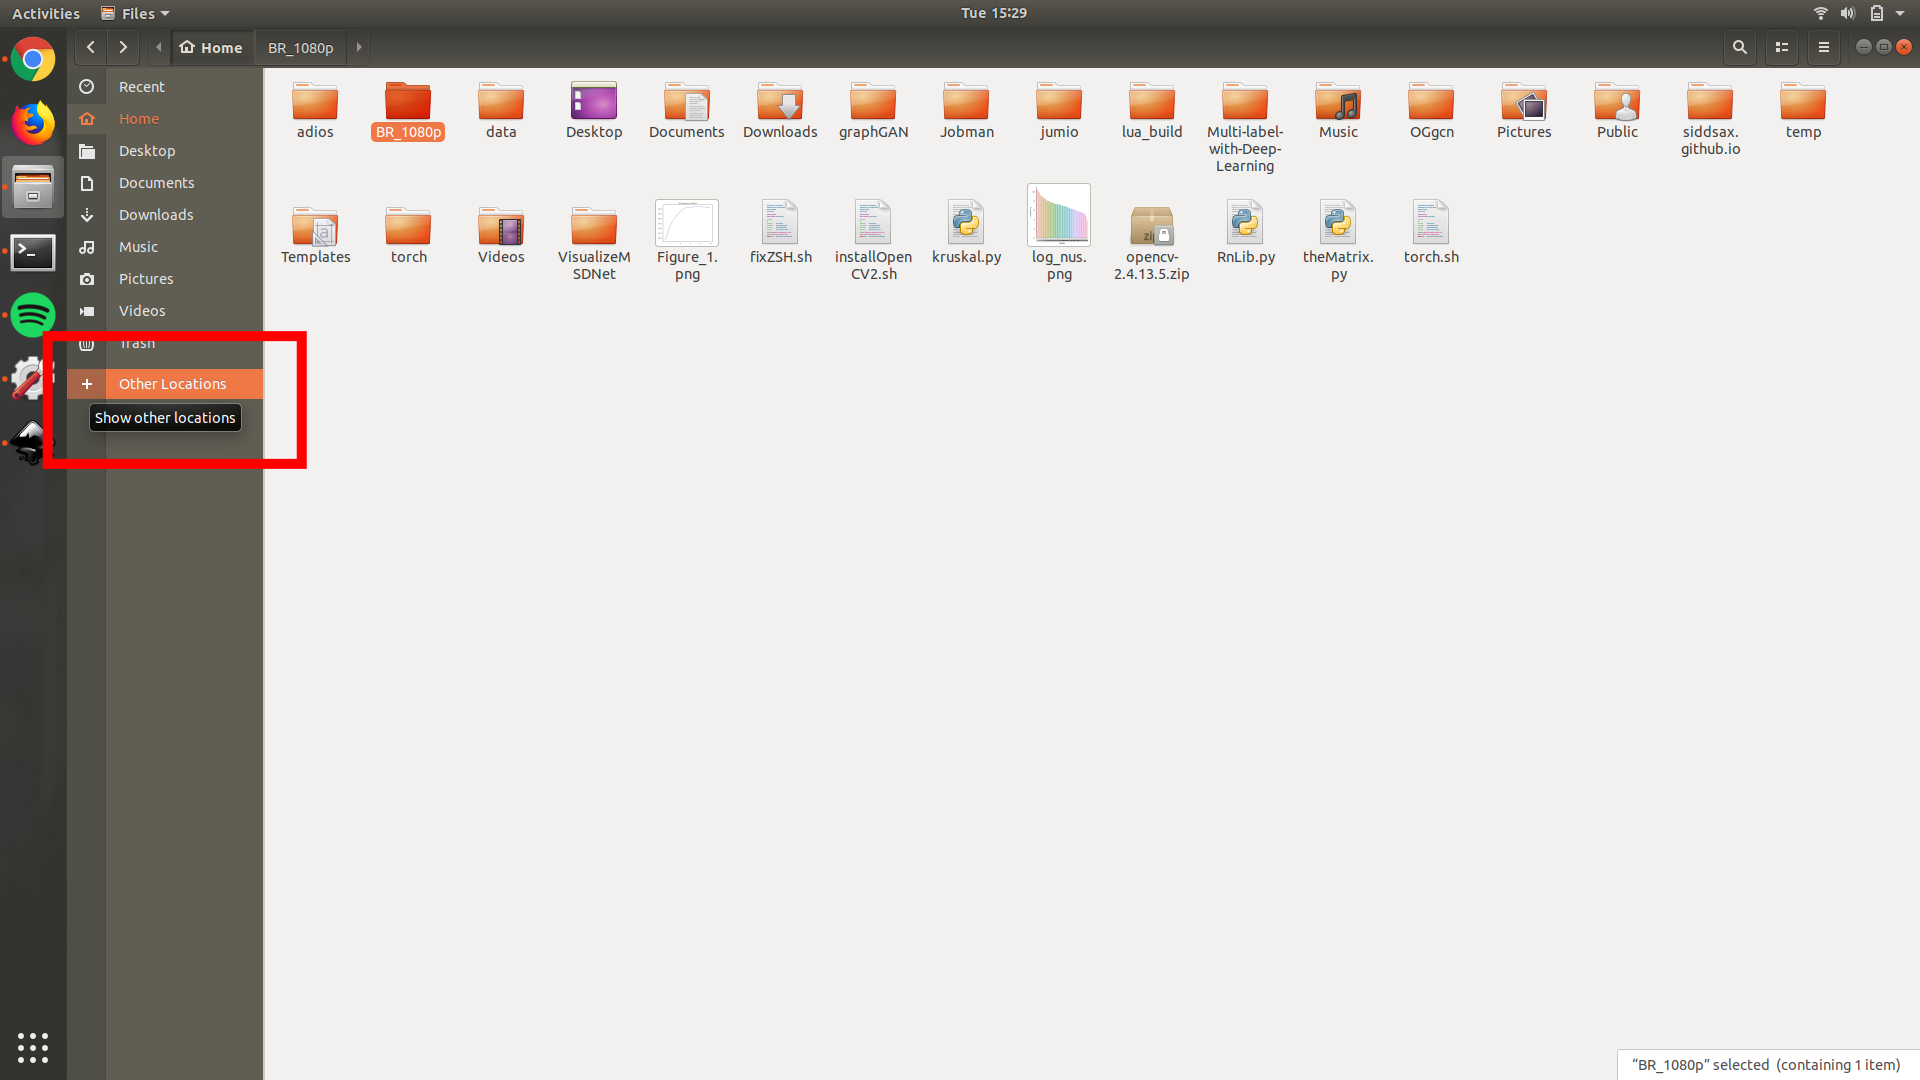
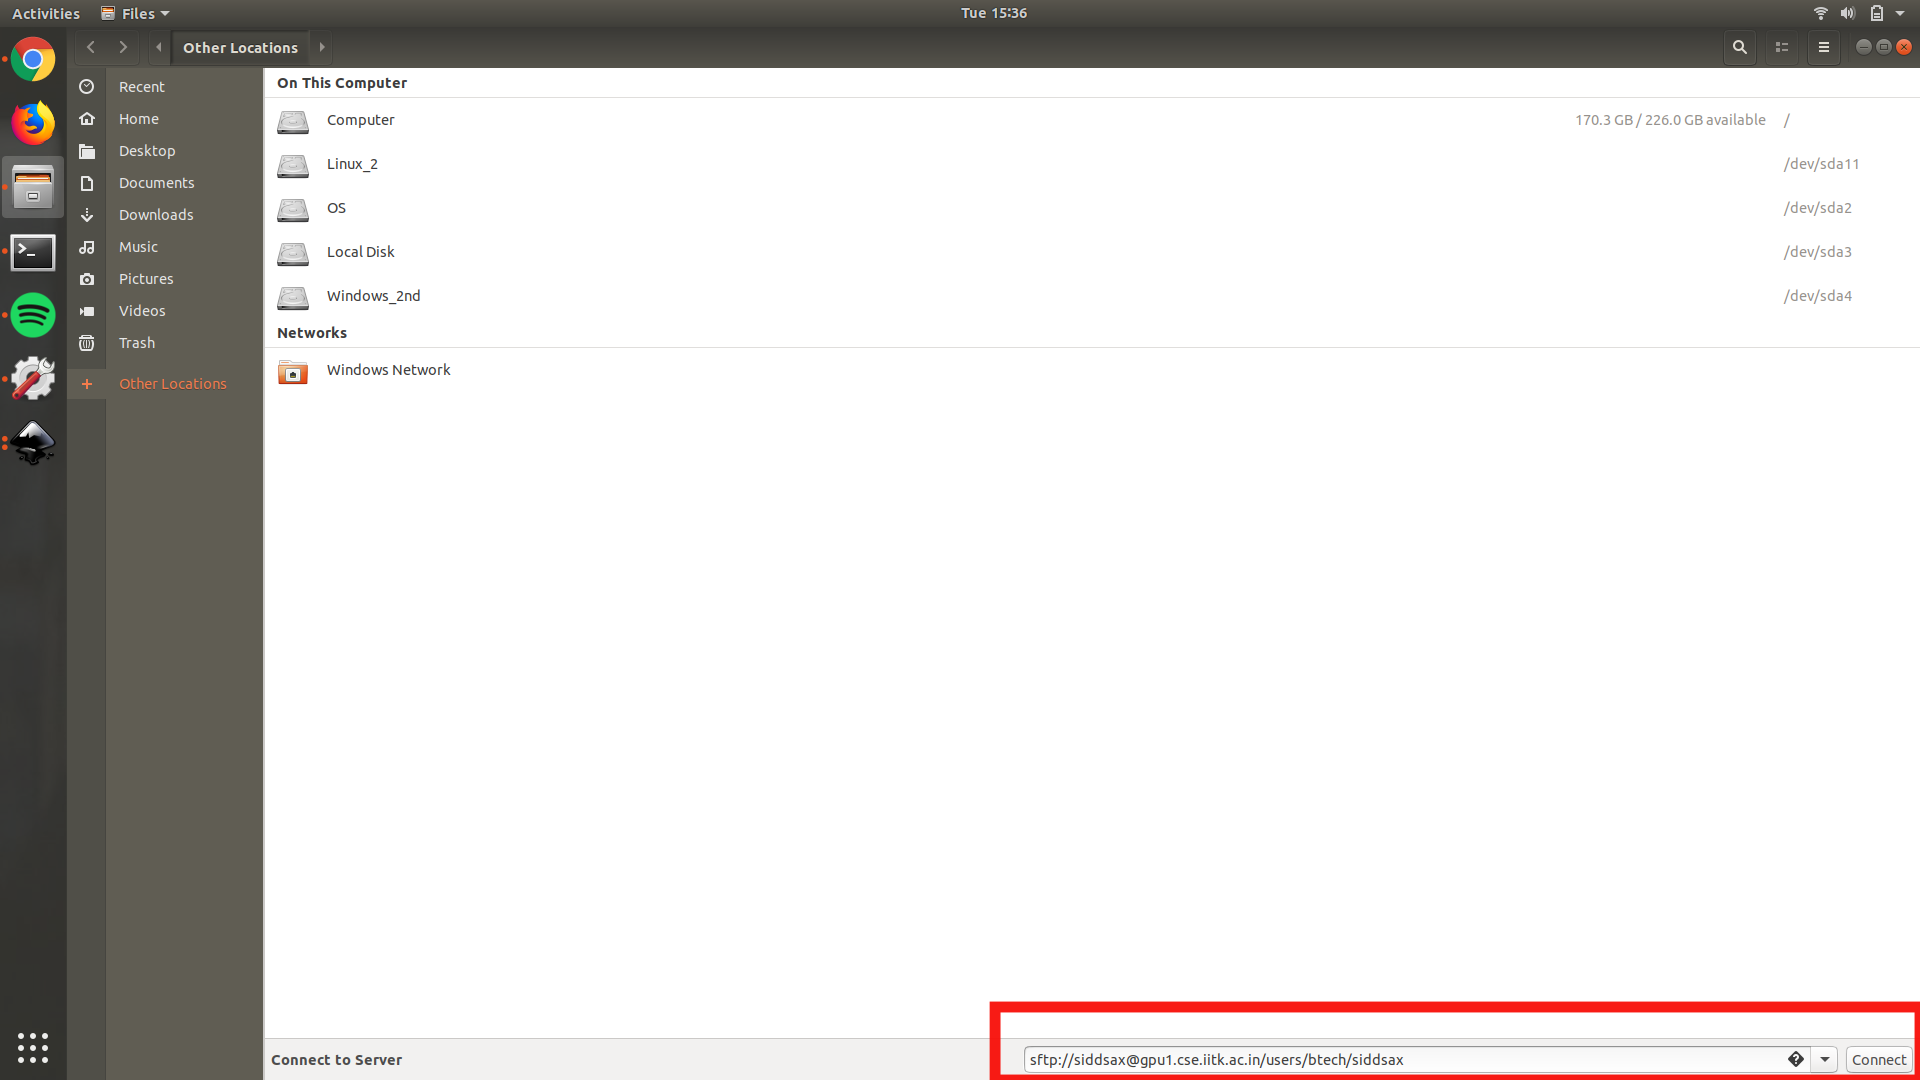
A side TIP, install sshpass from here. This reduces the need to enter the password for the server again and again which becomes tremendously annoying after some time. This one is particularly helpful if you have to look at images while training a model or don’t want to code on Vim. Using sftp client on ubuntu on can also mount the remote drive and access in a similar way to local drives. The steps here are for ubuntu 18.04 but overall its same for all except the location of buttons. Open nautilus/files on Ubuntu and navigate to Open Locations on the left pane.
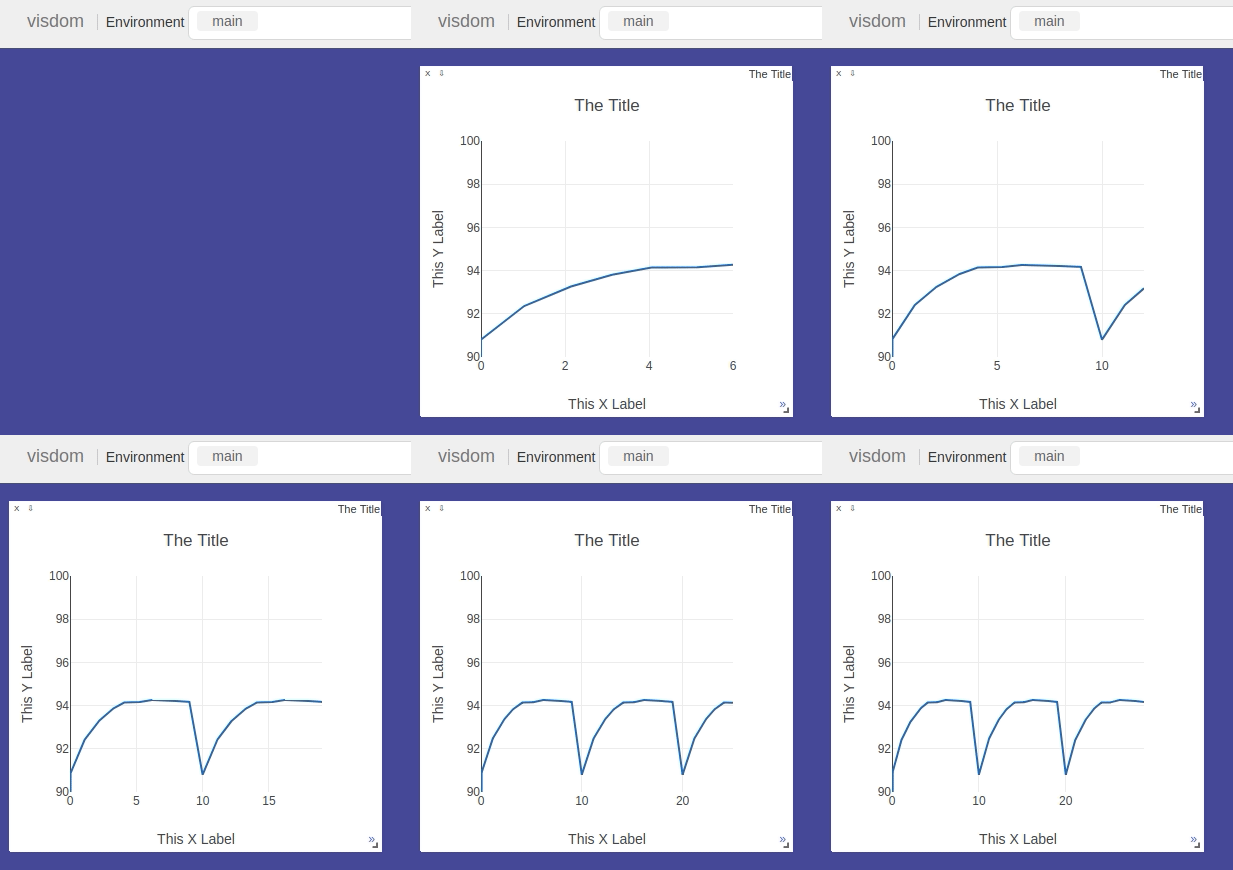
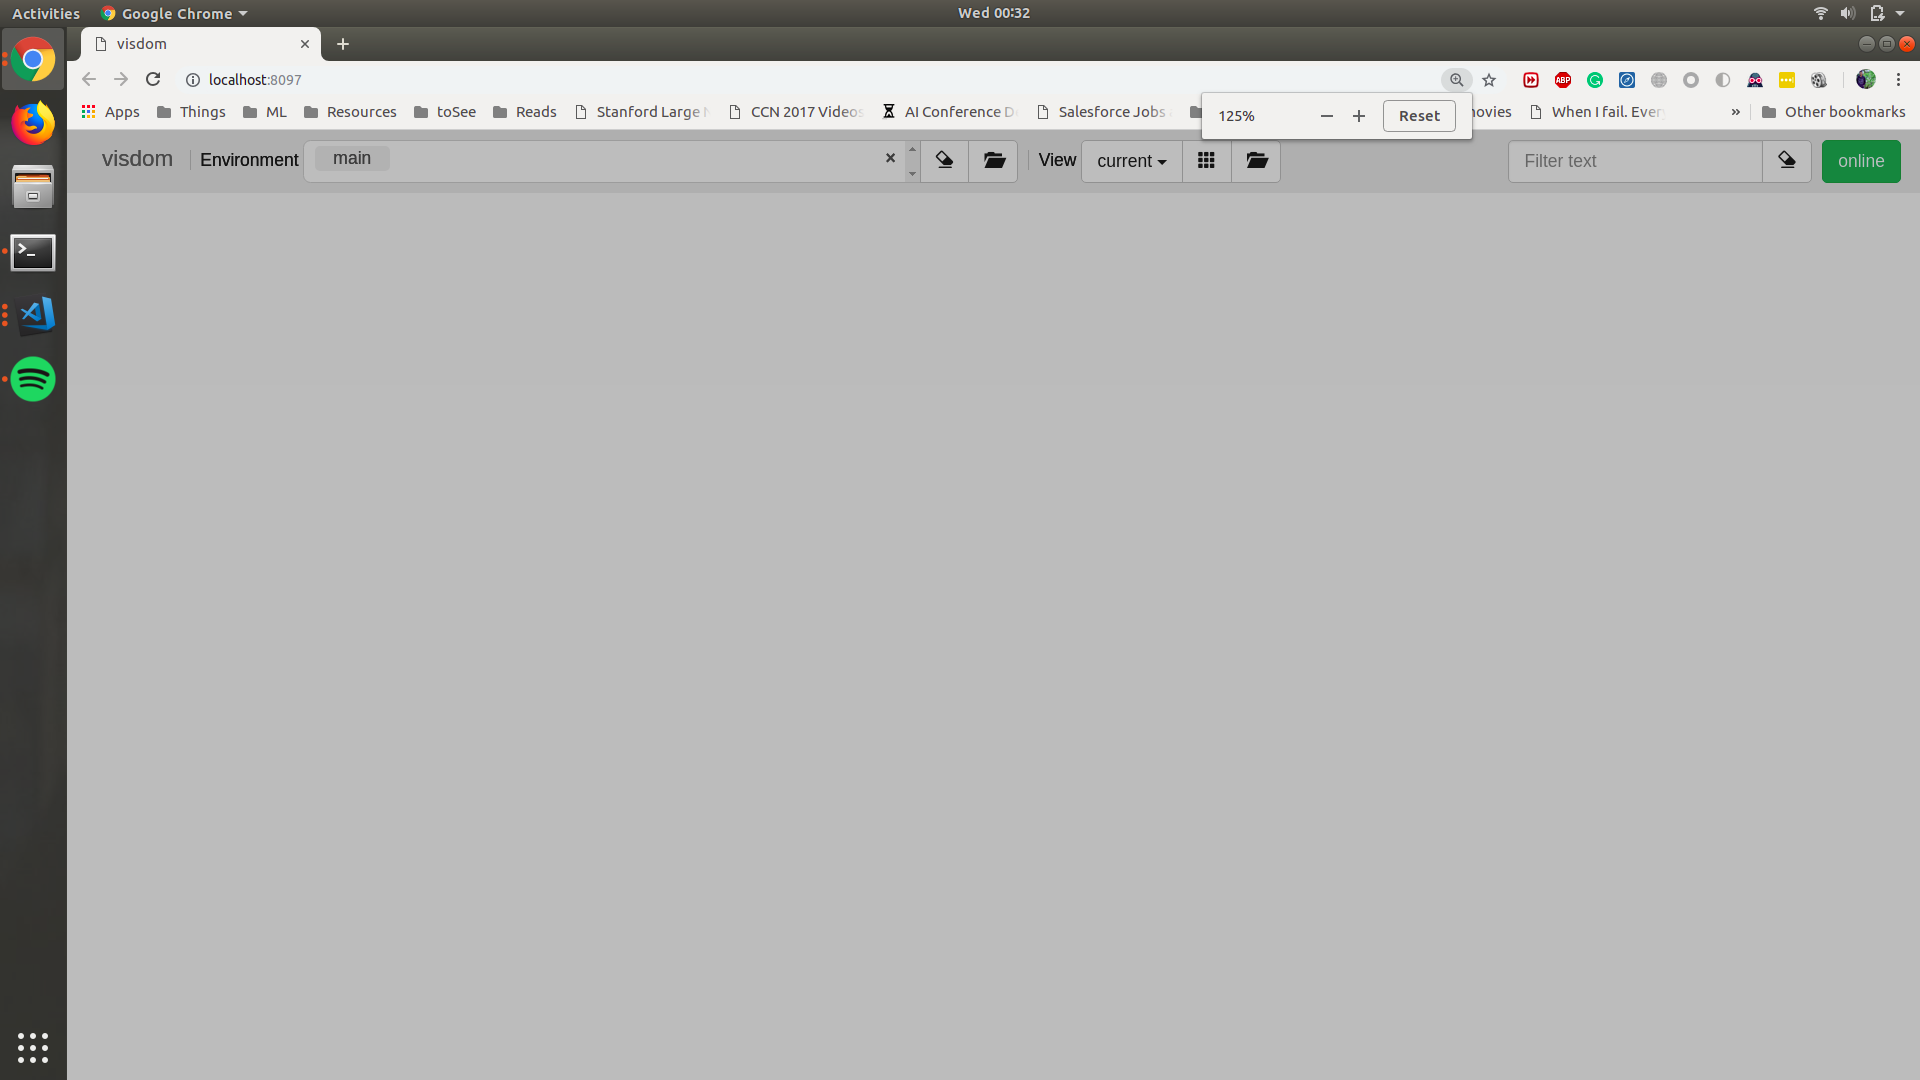
After that write-down username and address in the format Now you can use any GUI based editor of your choice ( psss! MS Code is the best :) ) GPUs are a crucial part for training deep learning models. Hence the are always in demand on large clusters shared by many people. This makes it important to know if the server is indeed available for use or not. This can simply be done with the The first half shows the global status of the GPUs on this server. The memory usage row is the key column which shows how much memory is being used up on that GPU. So in this case, if your process is small, it can still be run on GPU #2 (indexing from 0). But another important parameter is the GPU usage which fluctuates but if is higher than 50 at any point of time will mean that running another process on that GPU will slow down both of them as is in the case of GPU#2 here. Another important aspect is the number of cores on the CPU which comes into play when you are running models other than those that can run on GPUs such as SVMs. Here the equivalent tool is htop which might or might not be installed by default. In the case of the latter, one can also use top which is slightly less cool. This also has a similar format so I’ll not go into the details. If it needs to mentioned from here Packages can be one of the most hassle-free things or the most annoying things on a server depending on who is the admin or what are your needs. Most of the packages can be installed using Visualizations such as loss vs. iterations, or generated data are crucial metrics while training a model. The easiest way to achieve this is via mathplotlib (maybe not the best though) directly in the code but several times servers have a restriction on Xserver preventing the generation of GUIs. Another alternative similar to this is to save it to a figure, but that can be problematic at times. Here I’ll go over how to use Facebook’s Visdom or Google’s Tensorboard if on a server. Both of these are exceptional tools for visualizing without any time lags that might be there in previous ones due to the time needed to write files on the server. First here you can find some code to run Facebook’s Visdom module. The steps are as follows What we did above, is called ssh tunneling, as it creates a tunnel between your machine and the server. Now, http://localhost:8097 on the server is mapped to your computer’s localhost:8097. To access it simply open http://localhost:8097 in your browser. You should see something like this Now finally to test it, run the code on the server Now there should be a graph plotting as below
With this, I end this post here. Hope you got to know something or solved a problem!
How to access a server?
ssh username@server_address # it will first ask if you trust the server and the password for your username
ssh siddsax@gpu1.cse.iitk.ac.in
GUI on a server!
sftp://username@server_address/userHome Here the userHome is the home directory location of the user. If it’s not added then the root directory will be opened up instead.
Check for resources!
nvidia-smi or small tip watch -n .1 nvidia-smi to get live status of resources. Note: if you don’t have nvidia-smi then you have either an old GPU, or the GPU drivers are not installed.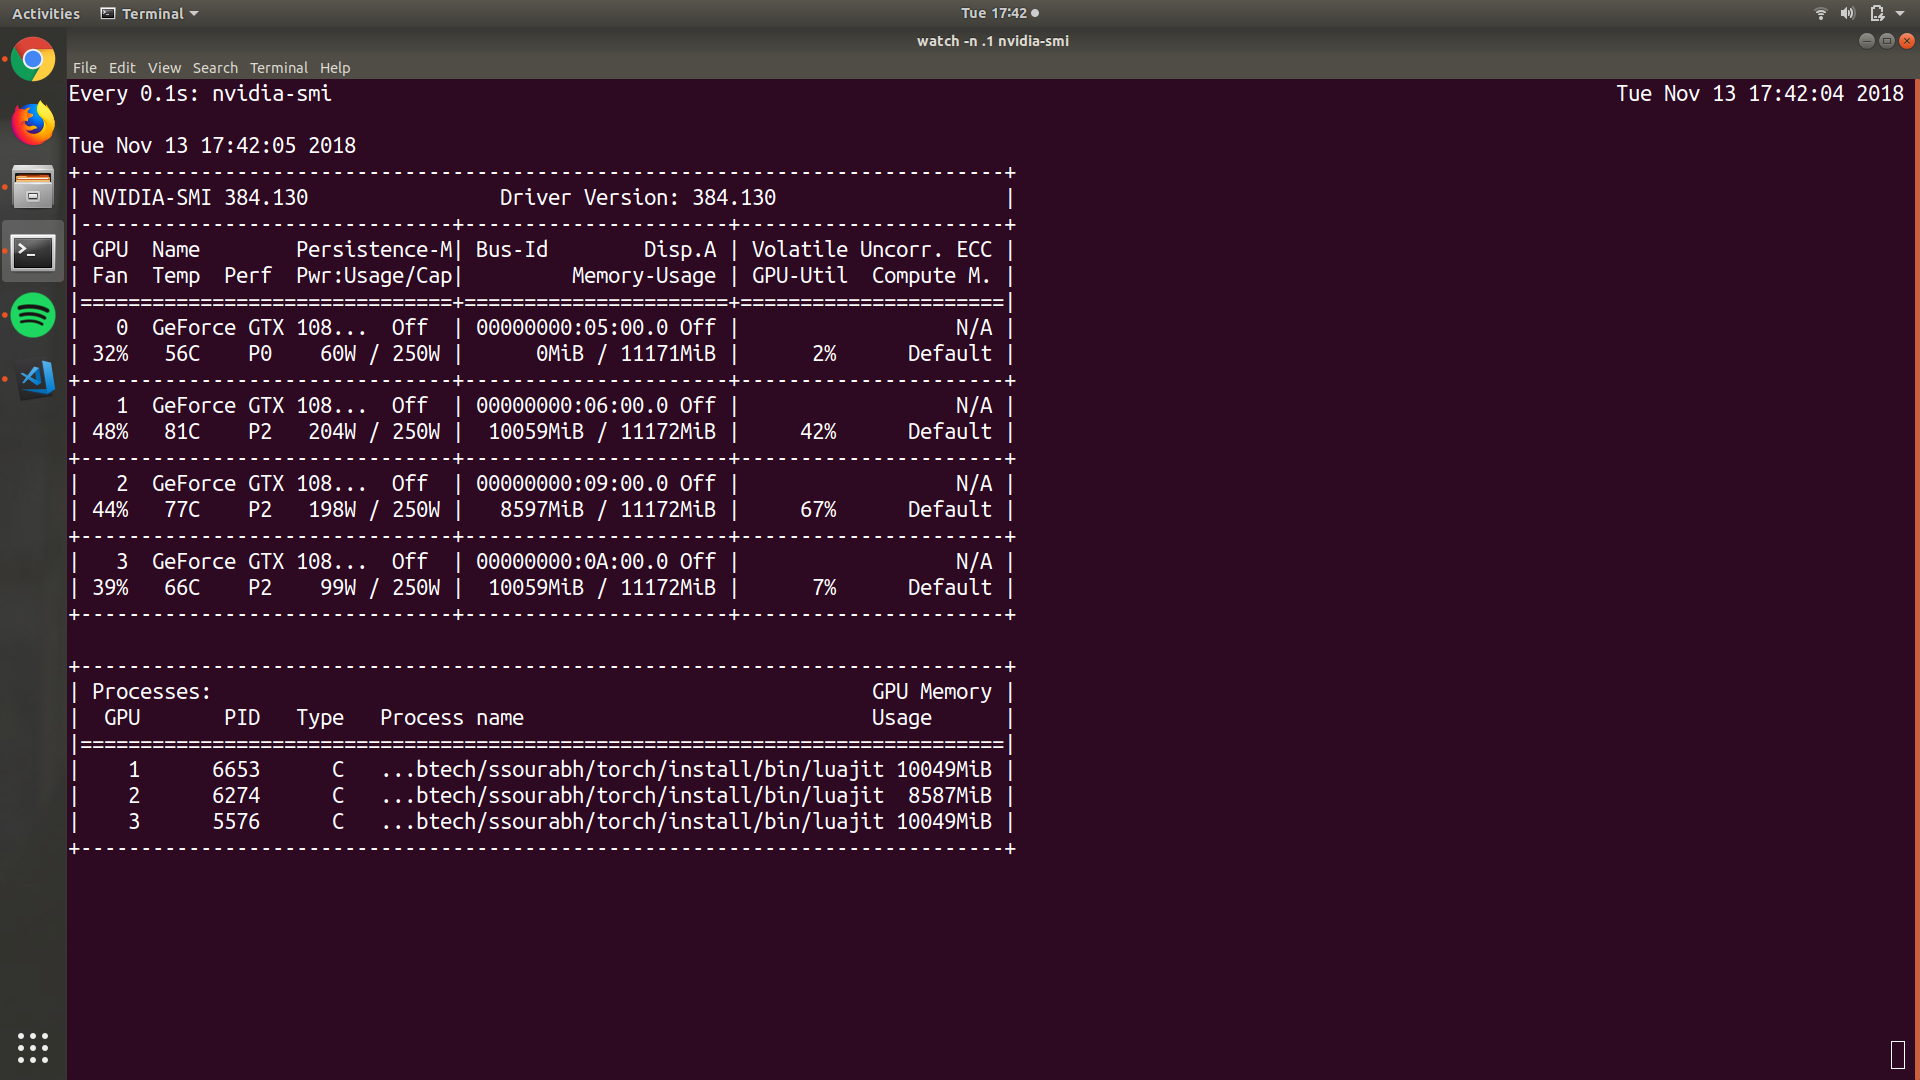 Here in this window, there are few things of importance. The lower half shows the processes that are currently running with the first column being the GPU numbers. Often as in this case a single process can span multiple GPUs. The last column in this part shows the amount of memory that they are using.
Install ZSH
Packages
pip install --user in a non-sudo environment but the preferable way is to use Anaconda. This is because anaconda makes it possible to have different versions of libraries on the same computer using environments. Hence its possible to run one code that depends on PyTorch 0.3.0 while developing on PyTorch 0.4.1Visualizations
pip  --user install visdom # on server
python -m visdom.server # on the server, it will first download some scripts
ssh -L 8097:localhost:8097 username@server_address # on your machine
cd $LocationGitRepo
python vizPlot.py
